Skip to content
Christman Field Latest Observations
Select Units
Date Time
MST
Temp
°F
RH
%
DewPt
°F
Wind
mph
Dir
°
Gust
mph
Dir
°
Press
in Hg
Solar
W/m^2
Prec
in
2023-06-09 04:00 55.5 80.7 49.7 5.9 342 7.0 340 24.860 0.0 0.00
2023-06-09 03:55 56.5 80.7 50.7 6.1 340 8.3 0 24.860 0.0 0.00
2023-06-09 03:50 56.1 78.3 49.5 3.5 282 4.3 282 24.860 0.0 0.00
2023-06-09 03:45 54.9 85.1 50.5 2.6 310 3.3 314 24.862 0.0 0.00
2023-06-09 03:40 54.6 86.6 50.7 2.5 269 3.3 276 24.863 0.0 0.00
2023-06-09 03:35 54.9 85.9 50.8 3.3 273 3.6 308 24.861 0.0 0.00
2023-06-09 03:30 55.5 84.1 50.8 2.6 314 3.3 319 24.860 0.0 0.00
2023-06-09 03:25 55.6 82.6 50.4 3.2 335 4.0 319 24.860 0.0 0.00
2023-06-09 03:20 55.4 83.4 50.4 3.6 314 4.3 324 24.861 0.0 0.00
2023-06-09 03:15 55.0 83.1 50.0 3.8 323 4.8 334 24.861 0.0 0.00
2023-06-09 03:10 55.5 83.3 50.6 1.4 298 4.8 323 24.862 0.0 0.00
2023-06-09 03:05 55.9 82.8 50.8 1.3 168 2.7 156 24.862 0.0 0.00
2023-06-09 03:00 56.3 81.5 50.7 1.8 156 2.6 156 24.864 0.0 0.00
2023-06-09 02:55 56.3 80.4 50.3 1.4 113 2.1 65 24.864 0.0 0.00
2023-06-09 02:50 55.9 79.1 49.6 2.0 64 2.4 43 24.866 0.0 0.00
2023-06-09 02:45 55.8 81.0 50.1 2.6 66 3.2 12 24.867 0.0 0.00
2023-06-09 02:40 56.0 81.1 50.3 3.1 1 4.7 310 24.870 0.0 0.00
2023-06-09 02:35 56.1 81.2 50.4 3.0 307 4.4 305 24.867 0.0 0.00
2023-06-09 02:30 55.9 82.4 50.6 0.8 354 1.7 355 24.864 0.0 0.00
2023-06-09 02:25 56.7 82.1 51.3 0.0 179 0.1 162 24.864 0.0 0.00
2023-06-09 02:20 56.9 78.2 50.2 0.6 43 1.7 43 24.865 0.0 0.00
2023-06-09 02:15 56.9 79.5 50.7 0.9 43 1.8 55 24.865 0.0 0.00
2023-06-09 02:10 56.8 79.5 50.5 0.8 54 1.8 65 24.864 0.0 0.00
2023-06-09 02:05 56.8 81.4 51.1 2.1 122 2.5 163 24.866 0.0 0.00
2023-06-09 02:00 57.1 80.1 51.0 1.9 211 2.8 284 24.864 0.0 0.00
2023-06-09 01:55 57.1 80.2 51.0 1.6 294 2.4 308 24.864 0.0 0.00
2023-06-09 01:50 57.4 80.0 51.3 2.9 283 3.9 315 24.863 0.0 0.00
2023-06-09 01:45 57.8 78.0 51.0 3.6 328 4.7 325 24.865 0.0 0.00
2023-06-09 01:40 57.1 78.0 50.3 3.1 329 5.2 315 24.868 0.0 0.00
2023-06-09 01:35 56.6 82.4 51.3 0.1 230 1.0 243 24.872 0.1 0.00
Date Time
MST
Temp
°C
RH
%
DewPt
°C
Wind
m/s
Dir
°
Gust
m/s
Dir
°
Press
hPa
Solar
W/m^2
Prec
mm
2023-06-09 04:00 13.1 80.7 9.8 2.6 342 3.1 340 841.85 0.0 0.00
2023-06-09 03:55 13.6 80.7 10.4 2.7 340 3.7 0 841.85 0.0 0.00
2023-06-09 03:50 13.4 78.3 9.7 1.6 282 1.9 282 841.86 0.0 0.00
2023-06-09 03:45 12.7 85.1 10.3 1.2 310 1.5 314 841.94 0.0 0.00
2023-06-09 03:40 12.6 86.6 10.4 1.1 269 1.5 276 841.97 0.0 0.00
2023-06-09 03:35 12.7 85.9 10.4 1.5 273 1.6 308 841.87 0.0 0.00
2023-06-09 03:30 13.1 84.1 10.5 1.2 314 1.5 319 841.85 0.0 0.00
2023-06-09 03:25 13.1 82.6 10.2 1.4 335 1.8 319 841.85 0.0 0.00
2023-06-09 03:20 13.0 83.4 10.2 1.6 314 1.9 324 841.88 0.0 0.00
2023-06-09 03:15 12.8 83.1 10.0 1.7 323 2.2 334 841.89 0.0 0.00
2023-06-09 03:10 13.1 83.3 10.3 0.6 298 2.2 323 841.94 0.0 0.00
2023-06-09 03:05 13.3 82.8 10.4 0.6 168 1.2 156 841.93 0.0 0.00
2023-06-09 03:00 13.5 81.5 10.4 0.8 156 1.2 156 841.98 0.0 0.00
2023-06-09 02:55 13.5 80.4 10.2 0.6 113 0.9 65 841.99 0.0 0.00
2023-06-09 02:50 13.3 79.1 9.8 0.9 64 1.1 43 842.04 0.0 0.00
2023-06-09 02:45 13.2 81.0 10.0 1.1 66 1.4 12 842.09 0.0 0.00
2023-06-09 02:40 13.3 81.1 10.2 1.4 1 2.1 310 842.19 0.0 0.00
2023-06-09 02:35 13.4 81.2 10.2 1.3 307 2.0 305 842.10 0.0 0.00
2023-06-09 02:30 13.3 82.4 10.3 0.4 354 0.7 355 841.99 0.0 0.00
2023-06-09 02:25 13.7 82.1 10.7 0.0 179 0.0 162 841.99 0.0 0.00
2023-06-09 02:20 13.8 78.2 10.1 0.3 43 0.7 43 842.02 0.0 0.00
2023-06-09 02:15 13.8 79.5 10.4 0.4 43 0.8 55 842.03 0.0 0.00
2023-06-09 02:10 13.8 79.5 10.3 0.4 54 0.8 65 841.98 0.0 0.00
2023-06-09 02:05 13.8 81.4 10.6 0.9 122 1.1 163 842.05 0.0 0.00
2023-06-09 02:00 13.9 80.1 10.5 0.8 211 1.3 284 841.98 0.0 0.00
2023-06-09 01:55 13.9 80.2 10.6 0.7 294 1.1 308 841.98 0.0 0.00
2023-06-09 01:50 14.1 80.0 10.7 1.3 283 1.7 315 841.96 0.0 0.00
2023-06-09 01:45 14.3 78.0 10.5 1.6 328 2.1 325 842.04 0.0 0.00
2023-06-09 01:40 14.0 78.0 10.2 1.4 329 2.3 315 842.11 0.0 0.00
2023-06-09 01:35 13.7 82.4 10.7 0.0 230 0.4 243 842.28 0.1 0.00
CIRA

Cooperative Institute for Research in the Atmosphere

AI Institute


Overview of AI Institute (aka AI2ES)


synergistic research path and applications diagram

NSF AI Institute for Research on Trustworthy AI in Weather, Climate, and Coastal Oceanography (AI2ES).

  • AI2ES was funded by the NSF in 2020 with a $20M grant over 5 years.
  • AI2ES is headquartered at the University of Oklahoma, and CSU is one of its founding members.
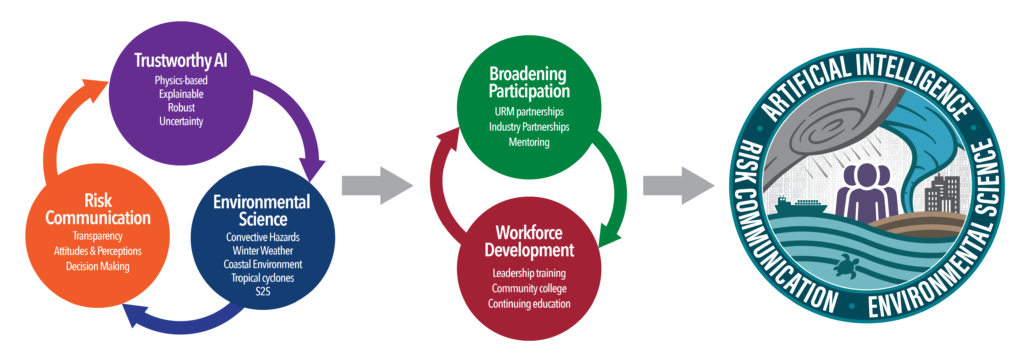
  • The graphic below gives a basic overview of the primary research areas AI2ES seeks to address and how they are connected.  For a more detailed explanation of AI2ES activities and philosophy, see https://www.ai2es.org/research/

AI2ES activities at CSU


Within CSU the core departments involved in AI2ES are

AI2ES activities at CIRA


Several of our CIRA members are funded by this NSF grant and are working on topics that are of interest to both CIRA and AI2ES.

CIRA activities related to this AI institute include:

  • Tropical cyclones:
    • Develop ML methods that can simulate passive microwave imagery from geostationary satellite imagery.
    • Goal:  Generate imagery that reveal internal structure of tropical cyclones at high temporal resolution.
  • XAI methods for weather and climate:
    • Select and adjust methods for eXplainable Artificial Intelligence (XAI) specifically for use in environmental applications.
  • Incorporating forecasters’ feedback: 
    • Work with an interdisciplinary team of risk communication experts, atmospheric scientists and AI experts on soliciting feedback from forecasters on which kinds of AI tools, visualization and explanations are actually useful for them.
    • Take that feedback into account to develop AI tools for forecasters that they actually find useful.
  • Ethical consideration for development of AI tools for environmental science 
    • Many people think that because AI is a mathematical tool it is objective in all aspects.  That’s not true.  There are many ways in which bias can sneak into the algorithms, such as
      • Bias in data (e.g., unevenly distributed sensor network, measurements only possible under certain conditions, etc.)
      • Bias can also arise from algorithm choices, e.g., spatial resolution of predictions greatly influences whether underrepresented groups are “averaged out”

Primary contact


Imme Ebert-Uphoff