Research Associate III – Software Engineer
He earned a B.A. in Computer Science from the University of Minnesota, and previously held software engineering roles such as Site Reliability/DevOps, to frontend Android applications, to full-stack web and cloud development, in organizations as large as Fortune 500 enterprises and as small as 50-person startups. His work in managing and visualizing air quality data, and his passion for contributing to the public good, led him to CIRA and NOAA’s Global Systems Lab in 2023.
Teams:
Projects or Work
IDSS Engine
Impact-based Decision Support Services Engine (IDSSE) is a web-based decision-making tool that helps meteorologists in the National Weather Service’s offices (WFOs, RFCs, etc.) provide clear, timely, and precise guidance to key members of the public who need decision support for their upcoming weather-dependent events.
This may be
- A county fire marshal scheduling a prescribed burn
- An event coordinator planning an outdoor music festival
- A transportation official allocating snow plow crews ahead of an impending storm
- A city health official opening warming/cooling shelters for vulnerable populations in their community
These officials make decisions that affect hundreds or thousands of residents, and they can’t just trust the weather forecast built into their smartphone like an average citizen; they need actionable guidance customized to their situation, and they need to plan responses hours or days in advance.
IDSS Engine provides simple visualizations to analyze and share out expected timeframes where the weather conditions at each event may approach concerning levels. Tech challenges include ingesting and assimilating vast amounts of data from probabilistic forecasts models, maximizing throughput and minimizing latency while balancing cloud hosting costs, and using progressive disclosure to clearly display to meteorologists exactly the information they need–no more or less–in a time-sensitive operational environment.
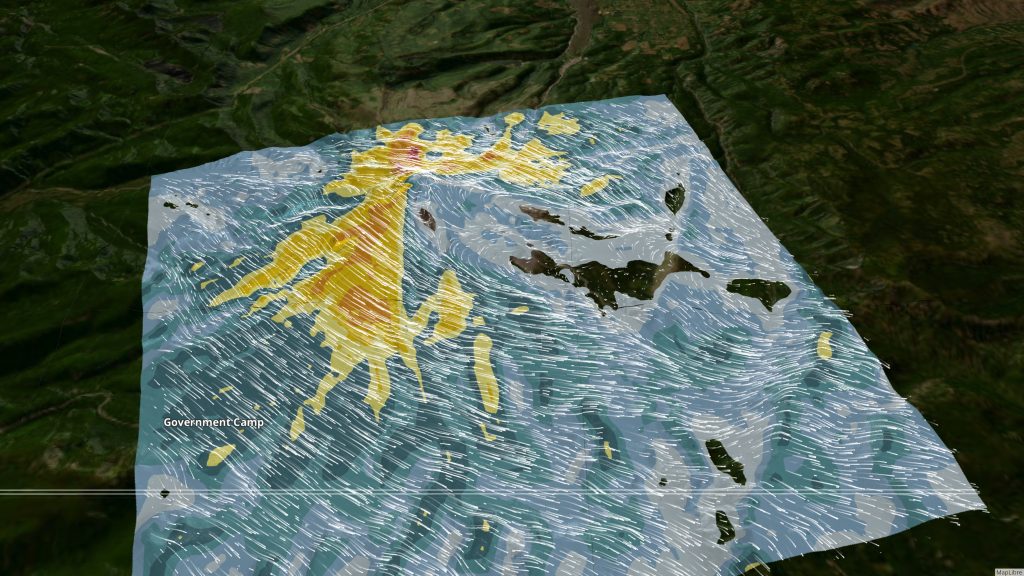
WindNinja
WindNinja is a high-resolution, diagnostic atmospheric model built by the U.S. Forest Service’s Missoula Fire Laboratory. Used by Forest Service fire crews for over 10 years, this precise model can downscale wind forecasts from numerical weather prediction (NWP) models–typically 3- to 9-kilometer resolution–down to 100-meter resolution wind maps that account for forestry and complex terrain. However, the scientific software can be hard for endusers to install and configure, and can require substantial compute resources to run efficiently.
The Fire Weather Testbed, within NOAA’s Global Systems Lab, partnered with the Missoula Fire Lab to host and visualize the WindNinja model entirely in the cloud, and build an automated, on-demand system for National Weather Service meteorologists to run WindNinja simulations from anywhere using only a web browser. The cloud-hosted system detects recently requested “spot forecasts”–a personalized forecast tailored to location and scenario of the forecaster or fire partner in the field–and automatically runs and visualizes WindNinja simulations in an existing weather visualization web app called DESI.
This integration directly into DESI allows meteorologists to view data in the same app they rely on to interrogate NWP forecasts, and it provided a workflow for users to request custom WindNinja simulations (over different areas, times, or using different runs of an NWP model). These visualization gives forecasters a quick and accessible dataset to help fire partners in the field, who may be battling flames in narrow canyons or heavily-forested mountains, to know precisely where and when the wind may strengthen, weaken, or shift.