Understanding flood danger both imminent and in the future – CIRA researchers at the forefront
By Theresa Barosh and Matt Rogers | July 2025

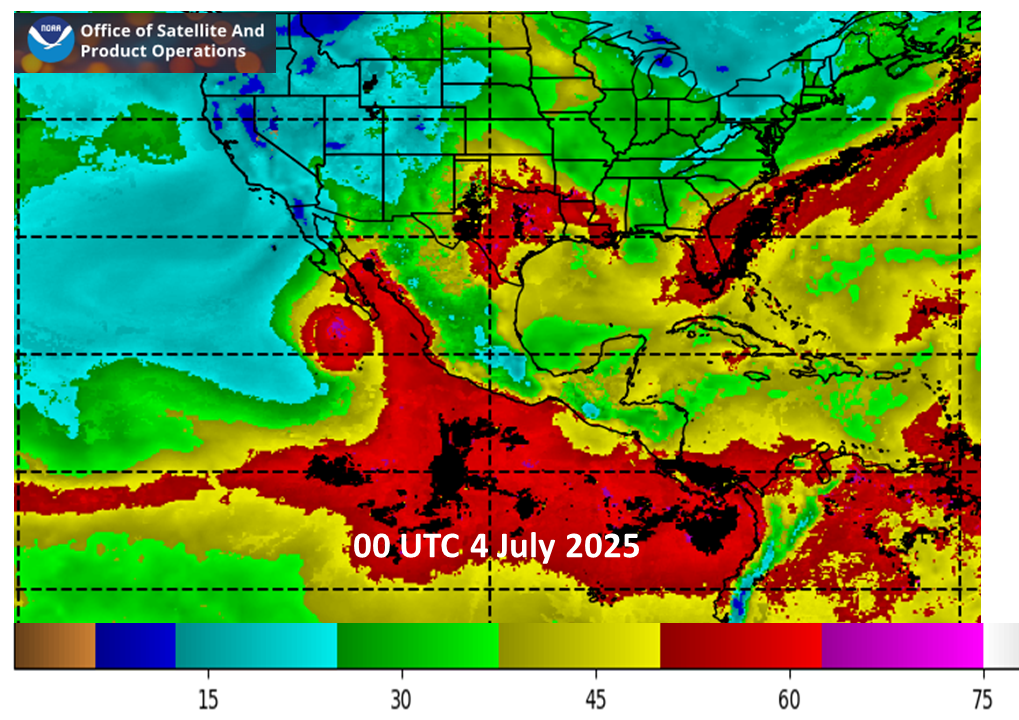
Instruments ABI | Timespan Start: 2025/07/03 18:01 – 2025/07/06 04:01
How much irrigation is needed? What amount of rainfall does a bridge or dam need to be able to withstand? What tools are used to forecast flash floods, and how is that data used by forecasters to provide timely and accurate warnings?
To answer these types of questions, researchers turn to satellite observations of atmospheric moisture, which are then compiled into long-term datasets. Forecasters looking to provide flash flood warnings are looking at constantly-updated observations of atmospheric moisture at multiple levels within the atmosphere; the collection of decades of this valuable data then informs other uses for industry and society.
When it comes to these long-term datasets, NASA is a leader in multidecadal records. CSU’s Cooperative Institute for Research in the Atmosphere has a team led by John Forsythe working with NASA on the next big water vapor dataset based on satellite information.

“Water vapor is the fuel which drives much of what we experience as weather, including destructive floods,” said Forsythe. “Water vapor must be depicted correctly in models if they are to be useful for a variety of applications.”
Forsythe and his team are working on an update and reprocessing of satellite derived water vapor to cover 40 years from 1988 to 2027. They’re using more powerful sensors and algorithms to make the update.
Previous Long-Term Records
The existing NASA Water Vapor Project (NVAP-M) dataset covers 1988 to 2009. It consists of daily, global total column water vapor and layer water vapor fields – in other words, the amount of water in the atmosphere and where it is around the whole world. The NVAP-M dataset was constructed from many different satellite observations.
Satellite-driven Earth System Data Records are essential for capturing processes, trends and extreme events. Long-term records are also important for comparison to proposed models. Researchers build models that represent their hypotheses about how the Earth system works, and they need accurate datasets to compare with model outputs. When the model results match real-world observations, researchers have good evidence to support their hypotheses.
“NVAP-M has been used by the scientific community to support process studies and weather case studies,” said Forsythe. “The emphasis on satellites makes it valuable for comparison to reanalysis products and for capturing extreme events which can be used to train AI models.”
One of the challenges of training artificial intelligence models is that they need a lot of information. Extreme events rarely happen, so having long-term datasets allows for more information about these types of events.
Short-Term, Urgent Situations
Sometimes the need for understanding atmospheric moisture is more urgent. When properties and lives are on the line, having dedicated researchers who understand the role that water in the atmosphere — called ‘precipitable water’, for its ability to create precipitation under the right circumstances — plays in forecasting of flooding events is critical.
CIRA researcher Sheldon Kusselson has spent decades in such a role; from analyzing real-time satellite observations of atmospheric moisture, to developing forecast tools for moisture using long-term datasets, and training National Weather Service forecasters with how best to use these observations. Kusselson has worked at the forefront of this field.
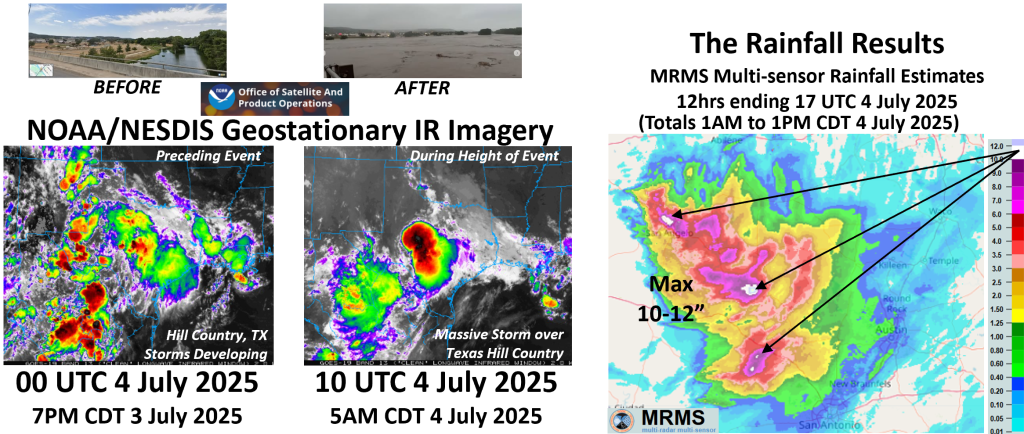
Texas Hill Country Floods
The tragic events of July 4 are actively being investigated, even as recovery work continues. What we know is that a historic collision of moisture converging from multiple directions — including the remnants of Tropical Storm Barry — created the ideal conditions for an epic amount of rainfall, made all the worse by its timing in the middle of night. In the very early hours of July 4, Forecaster Richard Otto of the NOAA/National Weather Service Weather Prediction Center, issued a ‘mesoscale precipitation discussion’ — think of it as a briefing for meteorologists from an expert precipitation meteorologist — for central Texas.
In that 12:26 a.m. CDT briefing before flooding started, Otto noted the potential for rainfall rates of two to three inches per hour, for storms that were forecasted to continue for hours on end. When you collect that much rain into a single watershed basin, you create an extremely dangerous situation for flash flooding. Inches of water per hour, collected over hundreds of square miles and funneled into one river basin will create a massive and sudden wall of water – which was precisely what was observed 3-4 hours later in the early morning along the Guadalupe River.
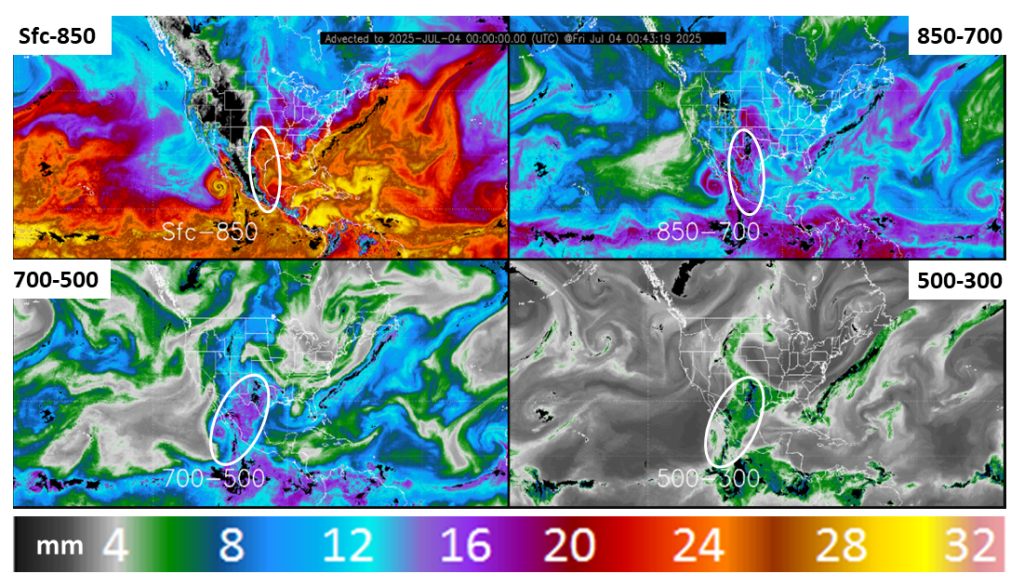
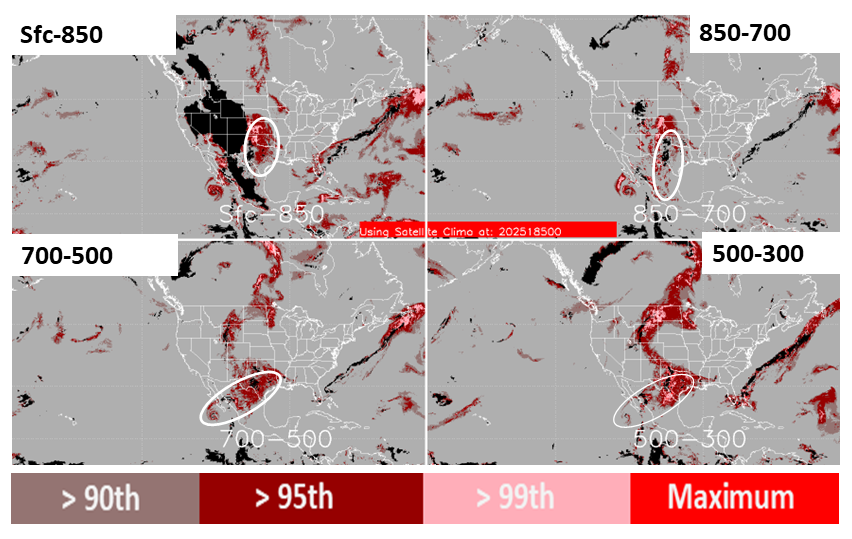
Otto’s analysis and forecast was supported by satellite moisture tools developed by CIRA. The Blended Total Precipitable Water (bTPW) and Advected Layered Precipitable Water (ALPW) products, developed by Forsythe, Kusselson and other CIRA and NOAA scientists were the primary tools in Otto’s analysis and forecast discussion. Directly from Otto’s discussion, “The region was located within an extremely moist environment containing 2.0 to 2.5 inches of PW [precipitable water] with contributions from the Gulf of America and tropical east Pacific clearly evident on layered PW imagery.”
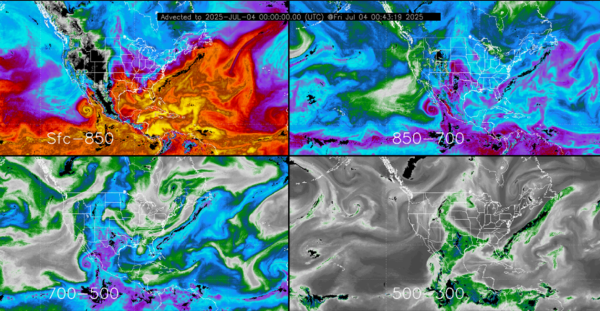
Previous floods events in Texas and the U.S. have been supercharged when the low-level and mid- to high-level pipelines of moisture combine. This is like having two firehoses aimed at a location instead of one. The CIRA-developed bTPW and ALPW products combines data from many low earth orbiting satellites to capture these pipelines of water vapor so forecasters can provide advance warning of destructive floods.
Knowing how much moisture was available to fuel storms and where the sources of additional moisture are located are critical tools for forecasters to use to create timely heavy precipitation forecasts.
“For the horrific flooding event of July 4, the tools developed by CIRA were at the forefront of providing the best data and information possible,” said Kusselson. “Despite the tragic outcome, NWS forecasters using CIRA developed satellite moisture products, throughout the night resulted in an accurate and timely analysis and forecast for the terrible tragedy that was about to unfold.”
We still have much to learn about the atmosphere, how best to understand the conditions that create these kinds of historic and destructive floods, and critically, how to communicate these hazards to the public — also an active area of CIRA research. With continued work in this area, CIRA leadership hopes that better outcomes for forecasts and for the public will help to prevent future disasters.
What is needed: Continued research on applications of geostationary and low earth orbiting satellite water vapor products and future sensors which measure the water vapor profile. In addition, more timely and accurate satellites with these future sensors. All of this in collaboration with NWS forecasters and NOAA and university research scientists to provide the most useful water vapor products for the saving of life and property.
In-Depth: CIRA developed satellite moisture products
Images provided by Sheldon Kusselson representing time point 00 UTC from Friday, July 4, which was at least 6 hours before the 2025 Texas Hill Country disaster began developing.
Kusselson also provided imagery representing before, during and throughout the event: